
What Your MPG Reading Actually Means - and Why It Fluctuates
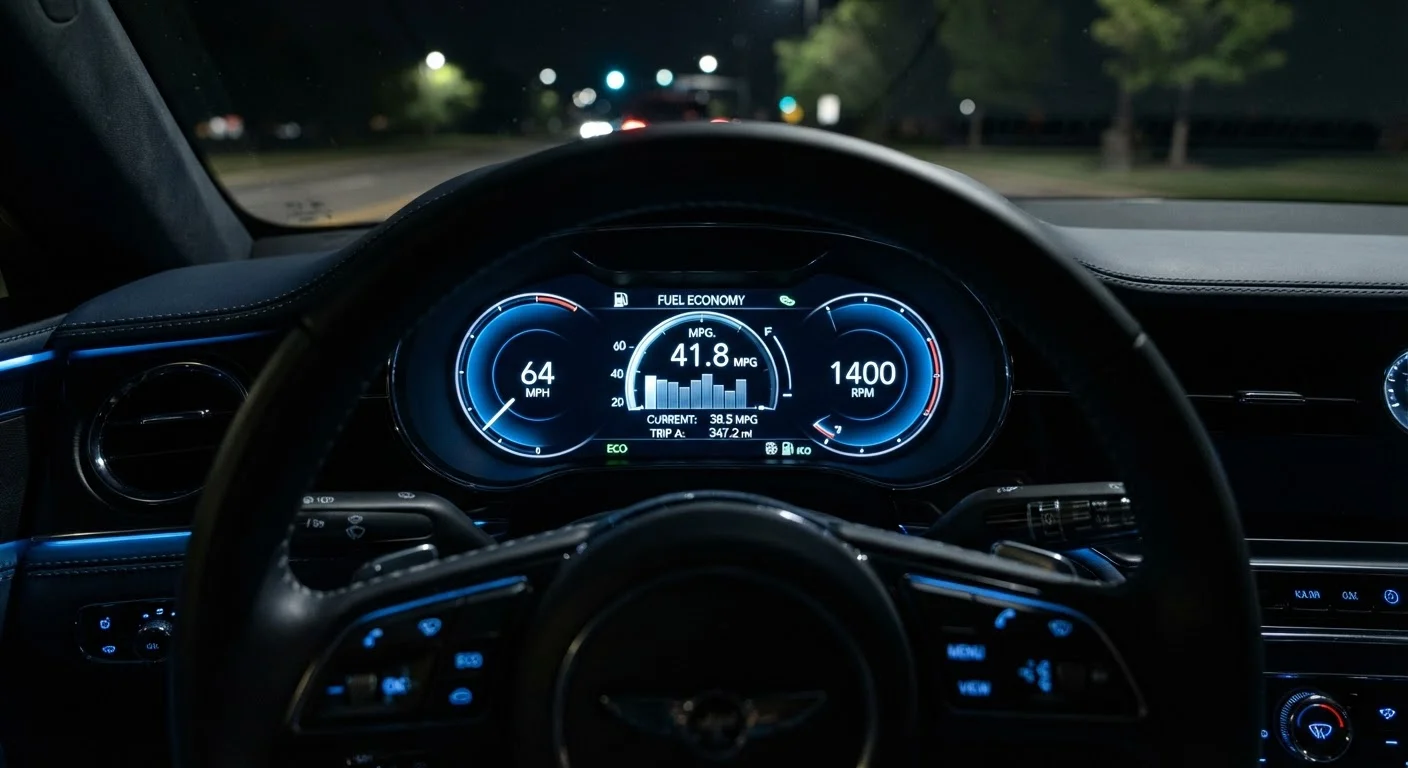
Photo credit: SmartReads.net | Simple Search, Relevant Results
In this article
Your fuel economy display doesn't tell the whole story. Here's how MPG is calculated, what affects it, and how to read it accurately.
Key Takeaways
- Instantaneous MPG and average MPG are two different readings that serve different purposes.
- Your EPA window sticker estimate is a lab benchmark, not a guarantee of real-world performance.
- Speed, temperature, load, and driving style all cause MPG to fluctuate significantly.
- Short trips disproportionately hurt fuel economy because engines are less efficient when cold.
- Tracking average MPG over full tank fill-ups gives you a more reliable picture than the dashboard alone.
Two Numbers, Not One
Most modern dashboards show at least two distinct MPG figures, and confusing them is one of the most common sources of misreading fuel economy. Instantaneous MPG reflects what your engine is burning right now - it spikes when you lift off the throttle downhill and collapses when you accelerate hard. It's reactive and volatile. Average MPG smooths that data over your current trip or since the last manual reset, giving you a more meaningful trend line.
Neither number is perfect. The average resets when you do, so a single long highway run can inflate it for weeks. To get the most honest read on your vehicle's real-world efficiency, calculate it yourself: note your odometer reading at each fill-up, record the gallons pumped, then divide miles driven by gallons used. Do this consistently across several tanks for a reliable baseline.
5-25%
MPG reduction from running A/C
According to the U.S. Department of Energy, air conditioning use can cut fuel economy by this range depending on conditions.
~3%
MPG gain from correct tire inflation
The U.S. Department of Energy estimates properly inflated tires can improve gas mileage by up to 3% compared to underinflated tires.
45-55 mph
Speed range for peak fuel efficiency
Most gasoline vehicles achieve their best MPG within this speed window before aerodynamic drag significantly increases fuel consumption.
What EPA Estimates Actually Represent
The MPG figures on a vehicle's window sticker come from EPA-standardized laboratory tests, not real roads. Engineers run the engine through scripted drive cycles on a dynamometer - a machine that simulates road load - while measuring tailpipe emissions to calculate fuel consumption. These cycles approximate city and highway patterns but can't capture every variable a driver encounters.
The EPA publishes a range alongside the combined estimate precisely because real-world results vary. Factors excluded from or simplified in the test - cold starts, accessory loads, individual driving behavior, elevation change - all influence how far short of or close to that sticker number you'll land. Understanding this gap matters: it's not a flaw in your car, it's the nature of how the benchmark is produced.
EPA Estimates Are a Comparison Tool
The primary value of the EPA sticker number is enabling apples-to-apples comparisons between vehicles tested under identical conditions - not predicting your exact real-world result. The EPA's fueleconomy.gov site includes a feedback tool where drivers can submit their actual MPG, offering a crowd-sourced complement to official estimates.
Why MPG Fluctuates - The Real Variables
Fuel economy is a moving target shaped by physics, environment, and behavior. Here's what moves it most:
- Speed: Aerodynamic drag increases with the square of vehicle speed. Fuel economy typically peaks between 45-55 mph and drops noticeably above 65 mph for most vehicles.
- Cold engines: Gasoline engines run rich during warm-up, burning more fuel per mile until operating temperature is reached. Short trips - under five miles - often never fully warm up, consistently dragging down your average.
- Accessory loads: Air conditioning, seat heaters, and headlights all draw energy the engine must supply. The A/C compressor is particularly significant in heavy traffic.
- Driving style: Hard acceleration followed by heavy braking wastes the kinetic energy you've already paid to build. Smooth acceleration and gradual braking directly extend how far each gallon takes you.
- Terrain and load: Hills, headwinds, extra passengers, and cargo all increase the work the engine must do.
For a deeper look at how city and highway conditions differ at the physics level, see how fuel economy differs between city and highway driving.
Track MPG at Every Fill-Up
Keep a simple note on your phone: odometer reading and gallons pumped each time you fill the tank. Divide miles driven by gallons used. Over five to ten fill-ups, you'll have a reliable real-world average that no dashboard reading can match for accuracy - and a baseline to spot efficiency changes early.
Using Your MPG Data Smarter
The goal isn't to chase the highest instantaneous MPG number - that way lies erratic driving. Instead, use your average MPG reading as a diagnostic signal. If your average drops over several consecutive tanks without a change in your routine, it may indicate a maintenance issue: underinflated tires, a clogged air filter, a failing oxygen sensor, or the need for fresh spark plugs.
For trip planning, your MPG average combined with your tank capacity gives you a realistic range estimate - far more useful than the dashboard's range counter, which uses recent driving data that may not match the road ahead. Planning fuel stops around terrain and traffic becomes much easier when you know your realistic per-tank range rather than an optimistic display figure.
If you're trying to improve efficiency over time, understanding which fuel-saving habits actually work is the logical next step - the evidence on some popular tips may surprise you.
Frequently Asked Questions

Author
Autos Editorial Team
Autos Editorial Team is the collective byline for our editorial team and contributor network. Articles published under this byline or an editorial pen name are researched, written, and reviewed according to our editorial standards for clarity, consistency, and independence before publication.
View all articles →